How to extract data from OpenFOAM log files with regular expressions and PyFoam
When you need to extract specific values from OpenFOAM log files.
Step-by-step guide
You will need to have PyFoam and gnuplot installed, as well as a file containing the details of the extracted fields.
-
Firstly, there needs to be a file inside the folder of case or in the same folder as the log file. The name of this file needs to be
customRegexpin order for the PyFoam command to automatically detect it.Inside the file you need to specify the values you wish to capture. For example in the file below we want to capture the values that are inside the log files and are in the format of the regular expression provided. Regular expressions are very strict and need to match exactly in order to get the results. All the Regexp-Groups (surrounded by “( )”) is used as data for plotting and in this case there is only one. %f% in this case acts as a variable since this is a value that is going to change inside the log file and we need to capture all of these different values.
Name and theTitle are used for naming the output file and the legend of the figure. Finally, titles is also used for the X-Y axis legends of the data lines found during fitting. These names are used in the order in which they are found in the regular expression, but in our case it is just one.
CpuTimePerTimeStep { expr "Time step CPU time: (%f%)"; name "CPU_Time_per_time_step"; theTitle "CPU Time per time step"; titles ( "time_step" ); type regular; } -
Execute the following command to get a plot that updates whenever there are changes. When finished the user has to stop the process (Ctrl + C).
pyFoamPlotWatcher.py --write-files --single-data-files-only --hardcopy log.pimpleFoampyFoamPlotWatcher.pyis an executable that should be available if PyFoam is installed on the system. It provides a lot of options, for changing the gnuplot terminal, where to find the regular expression file, what to plot and many more. Here we are using three options: the first one (write-files) is used to create files of the parsed data that the user can later access and the second one is used so that there is a single file containing all the different values instead of creating a new file for each new value. The third option will create png (can be modified) files at the end of the process.For example if we have a log file like this
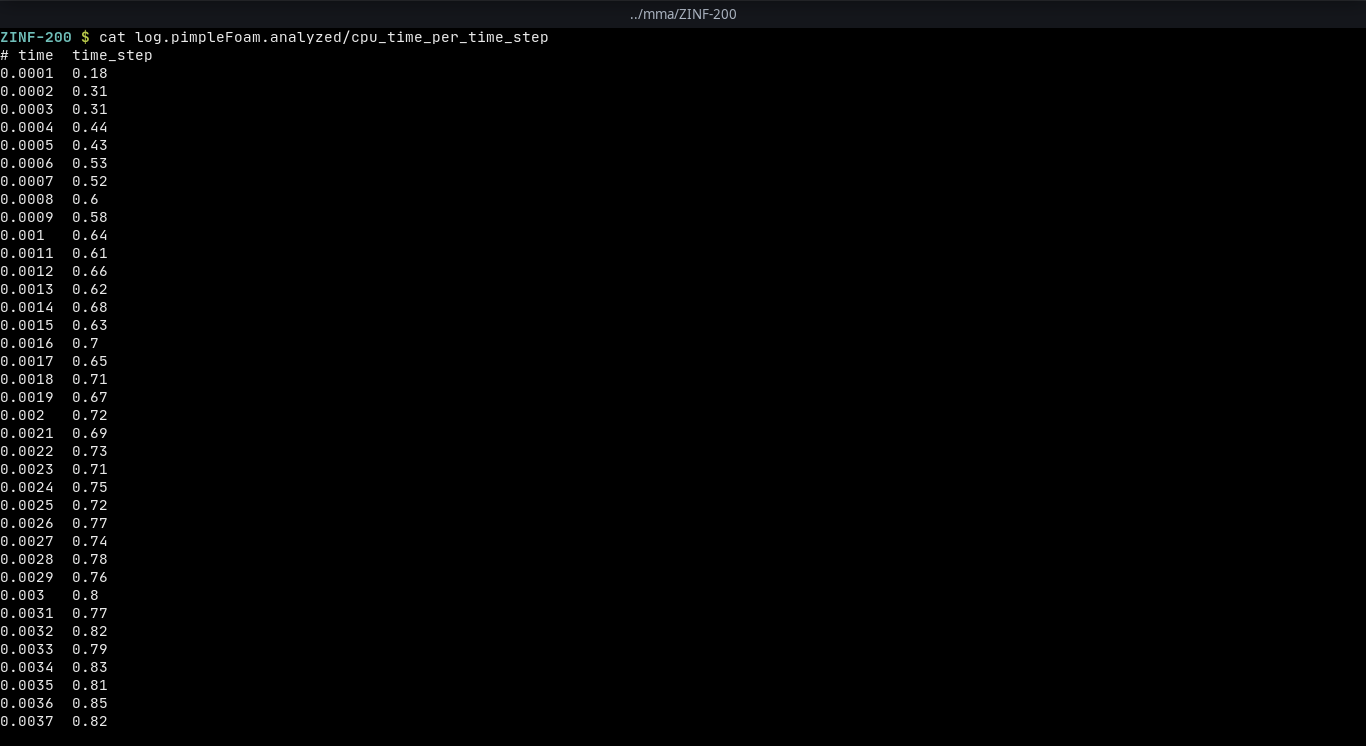
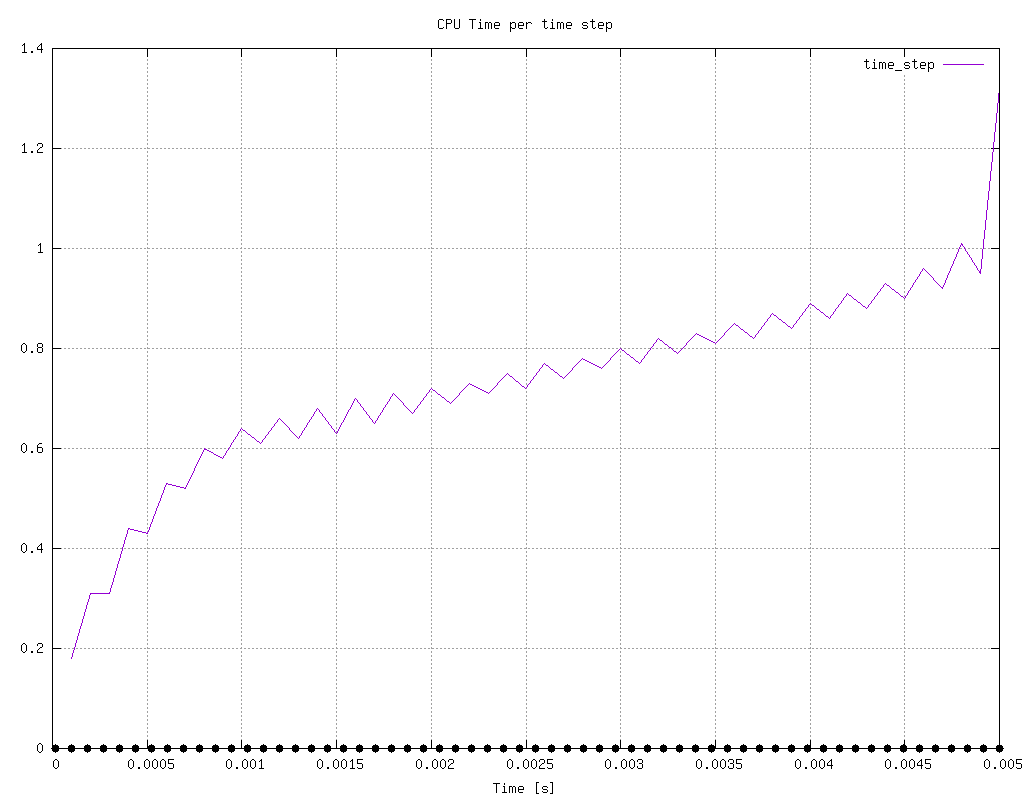
log.pimpleFoamDownload and parse it with the command above a folder with the name log.pimpleFoam.analyzed will be created in the same folder and a file named cpu_time_per_time_step will contain all of the values with respect to time. This file will keep updating until the user decides to stop the process. Furthermore, at the end of the process png files are created automatically with the use of the hardcopy option on the command above that look like the figure below.
Attachments
Here you can find the log.pimpleFoam-file used as an example above:
See also
- How to write a set of points to VTK in OpenFOAM using legacy code
- How to use pyFoam to create parameter variations in OpenFOAM
- How to point the ParaView state file to the local directory
- How to plot columns from a multi-indexed DataFrame in pandas
- How to add the rate of convergence column to a pandas dataframe